What do the stats tell us? – Australia vs South Africa
Overall for this time
There seems to be no real consistency in the stats for both teams in 2012. It pretty clear that the team that get to play the game plan they will win. This will be more critical for the Wallabies than the Springboks.
What I’ve found interesting just isolating out the Wallabies games playing the All Blacks is how the numbers are reversed in a lot of the charts between the two games. This is a symptom of a team that can’t get their game plan working. This will need to change or the Springboks kicking game will win out.
The Wallabies need to sort out their defence, while it is not bad, they are missing more tackles than they are breaking. The Wallabies are getting into the 22 but are not converting this into points. They really need to step this up if they want to win. According to the stats, I think they can look at different options inside the Springboks 22 and don’t need to commit so many at the breakdown in this zone. The stats suggest South Africa don’t tend to compete that much at the breakdown in their 22 (they are either not wanting to give a penalty away or loading up the defensive line).
Expect the Springboks to kick to the Wallabies a lot and the game plan should reflect some counter attacking by Australia in this regard. They will get the chances but it is picking the right one to push is the key. From the stats expect the Springboks to hit rucks all day, then kick it down town for field position.
One of the things the Springboks need to get on top of is the errors they make when they get inside the oppositions 22. If they continue to make these handling errors and conceding penalties then it going to keep handing advantage to the Wallabies.
There are a number of stats that are very close together or identical in key aspects of the game. This is a little weird given that they are yet to play a team that the other has in 2012. This makes it a little hard to give the edge to either team and usually means the bounce of the ball, or even worse the ref sort out the result. Owens is in charge and that is not a bad thing. I spare you my rant about Chris Pollack.
The restarts (kick off, 22 drop outs) look to be largely procedural as so far neither team really wants to compete in this area.
If the teams play to their stats and of course there is a reason the ball is oval, then …
“The team that wins will be the one that is allowed to play their game plan, if the game plan is an effective one. There will be chances and they need to be taken. It’s that simple.”
The rest of the document is just some rambling with a few charts thrown in to back up my points. Enjoy the next 20 odd pages of it.
New Charts
I’ve done some more charts and tidied up the others during the bye week. It makes it a hell of lot easier to chart for me just in case you are wondering. Some of the new charts highlight the zones in which some of the things are happening. These appear as fields. Note this is for the zone not the correct X & Y grid co-ordinates.
All the charts at the far right have a few averages: the June average for that team for that aspect; The Rugby Championship average for that team for that aspect; and the 2012 average for that aspect and team. This is you give you, the very important client, more insight as some of you (you know who you are) don’t put much stock in the Junes tests.
Field position
Both teams like to have possession and territory (note 1). During 2012 the Springboks possession and territory has been pretty consistent (see below), but the Wallabies have had a lot more variation. This either reflects a changing game plan by the Wallabies, or the opposition are dictating the game plan.
Both teams like to spend time in the oppositions 22 and not much separates them (note 2). Both teams are higher than the South Hemisphere 2012 average of 17.5%. The Wallabies are averaging 18.5% compared to the Springboks 19.8% (note2). The Wallabies need to convert more when they get into the 22.
So expect these teams once they get into the opposition’s half to move quickly into the 22. If teams stick to their stats then expect over a 1/3rd of the game spent inside the 22 and that is good for the spectators, not their hearts or stress levels though.
Now the interesting thing is Australia time inside the opposition 22 has been heading south since Scotland. Look below and see it is a nice little sliding scale in blue columns with my red drawing of a arrow. It was heading down before playing the All Blacks so this is a real trend. South Africa’s time in opposition 22 (coloured brown) is more like a roller coaster, ups and downs. Read into that what you will.
Points
Interestingly enough the Wallabies are scoring an average of 16.2 points a game which is close to the 16.0 points that the Springboks are conceding (note 3).
The Springboks are scoring more than twice as many tries per game as the Wallabies (note 4), but both teams are conceding exactly the same amount of tries of 1.2 per game (note 5). They also have the same probability of landing a drop goal (note 8).
The Wallabies are opting to kick for goal when awarded a penalty 35.4% of the time which is significantly lower that the Springboks who are averaging 49.0% (note 6). When conceding a penalty kick that the opposition will opt to kick for goal, the teams are similar with 45.7% and 43.9% respectively.
New for this comp is the field zone of where these teams are conceding penalties. This is not the X & Y grid co-ordinates, but the zones that it is happening in. From the new charts below it shows the Wallabies are conceding 19.7% of their penalties inside the Australian 22, compared to 18.8% that the Springboks do.
The Springboks are conceding more penalties inside the oppositions 22. This should be known as the ‘Get out of jail free’ stat as basically it just stuffs up all the work to get into this zone. I shouldn’t be too hard on the Springboks as the All Black concede 24% of the penalties inside the opposition’s 22. So this makes the Wallabies 16.4% look quite good.
In terms of arbitrages there two interesting ones. The Springboks are more likely to score a try on the RIGHT side of the field (note 10) and this is the side of the field the Wallabies are more likely to concede a try (note 12). However the Wallabies are more likely to receive a penalty kick they will opt for a goals kick on the RIGHT side of the field (note 9) which is also the side the Springboks are more likely to concede them (note12).
The Boot
Both teams use the boot at a different ratio with the Springboks kicking more than the Wallabies. Given that the teams both enjoy more than 50% territory (note 2) the Wallabies kicking numbers are a little odd. This will make the boot a point in the game.
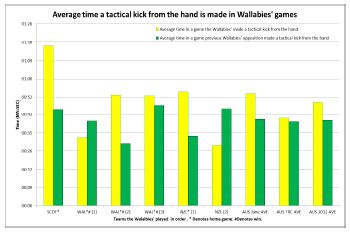
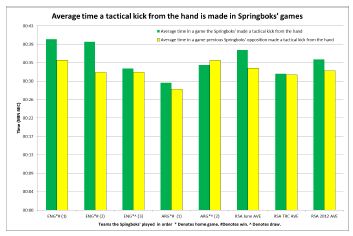
The Wallabies make a tactical kick an average of 49 seconds and this is much longer than the Springboks who kick every 35 seconds (note 20). Both teams previous opposition also kicked a lot during the game as well. Teams playing the Wallabies were making a tactical kick from the hand every 40 seconds compared to teams playing the Springboks who kick every 33 seconds (note 21).
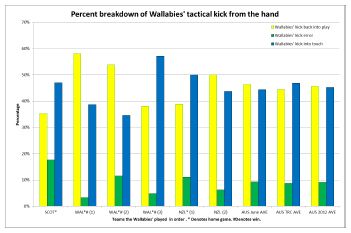
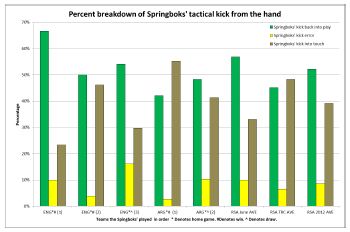
When making a tactical kick from the hand, these teams take different options. The Springboks are kicking the ball back into the field of play more than the Wallabies with 52.2% of the time compared to 45.7% of the time (note 17). The Wallabies are kicking for touch 45.7% of the time compared to the Springboks’ 39.2% (note 19). The Wallabies need to get on top of their kicking errors as they are making 9.1% in the game, but not much more than the Springboks who are making 8.6% (note 18).
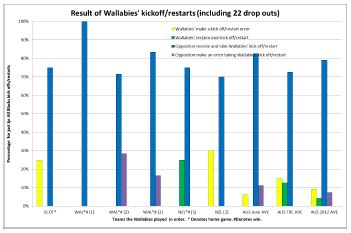
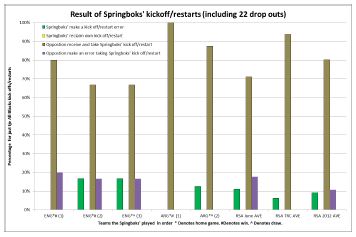
The kicks offs, restarts and 22 drop outs stats suggest that this part of the game is merely a formality. The Wallabies are reclaim only 4.2% of their restarts and that is much better than the Springboks who are yet to reclaim one (note 44). This suggests that both teams employ a long kick for the restart and this fits into time spent inside the opp 22 (note 2).
Both teams have the same risk of making an error on their own kick off (note 43).
The ‘Sumo’ stat
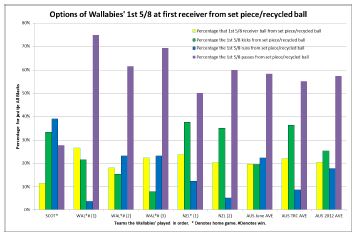
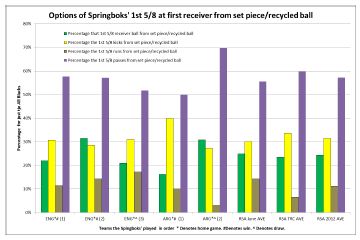
The Wallabies employ their 1st 5/8 as first receiver from set piece/recycled ball 20.4% of the time compare to 24.3% that of the Springboks (note 22). It is interesting to note that the use of Cooper in the last match and the options he took were not too different to Barnes in the four previous games in the Wallabies jersey. The Scotland game is different due to the weather.
The point is and I do have one, is that Cooper didn’t run that much as 1st receiver compared to Barnes and he also passes more. This is interesting as he was brought in as a playmaker or the game plan wasn’t to use as that function.
Both teams as a statistical little quirk are having their 1st 5/8 as first receiver from set piece/recycled ball pass 57.3% of the time (note 25). Therefore the difference is that the Wallabies 1st 5/8 are running more than Steyn 17.7% to 11.2% respectively (note 24). This means Australia are kicking less, 25.1% compared to 31.5% for the Springboks (note 23). However and it is a big however Steyn is running the ball so much more this year than the last. Also when he does run he is either out of options and caught or is setting up a try.
The Breakdown
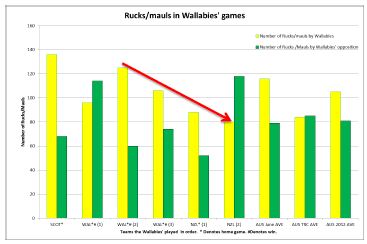
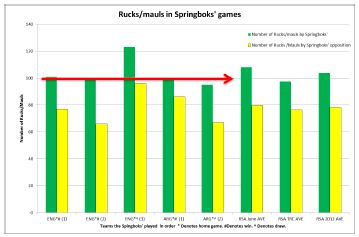
These teams take the ball into the ruck/maul a similar number of times (note 13), with the Wallabies slightly ahead with 105.2 to the Springboks 103.8. Defensively the number of rucks previous oppositions are a lot lower and virtually identical (note 26) 81.0 and 78.4 respectively.
While South Africa has had the majority of rucks/mauls in the game, Australia number of rucks is decreasing, like time in the opposition’s 22 the (see charts below).
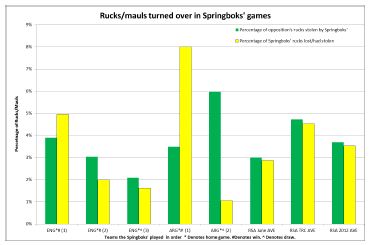
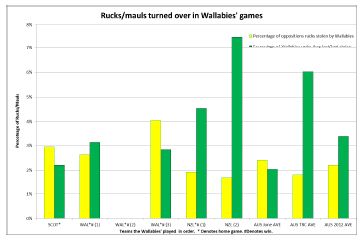
At the breakdown these teams have a lot more work to do. The Springbok let Argentina steal 8% of their rucks in the first match. This could have affected the game plan in the second match as this number dropped off to 1%.
The Springboks are turning over an average of 3.7% of opposition’s rucks in a game compared to the Wallabies 2.2% (note 27).However when it comes to getting the ball stolen from the ruck you take it into, the Springboks lose 3.5% and the Wallabies are losing 3.4%(note 35).
This means the Wallabies have a net loss of 1.2% (2.2% – 3.4%) of turnover rucks, compared to the very small net gain of the 0.2% for the Springboks (3.7%-3.5%).
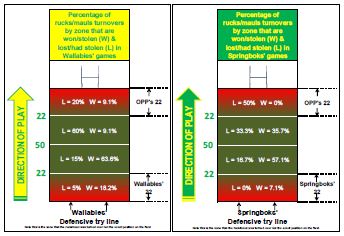
New for this comp is the field position of where these teams are stealing ruck and getting them stolen. From the new charts below it shows the 50% of the time the Springboks losing or get the pill stolen it will be in the opposition’s 22 compared to the Wallabies where 20% of the rucks they lose or get stolen are in the opposition’s 22.This is not the X & Y grid co-ordinates, but the zones that it happens in.
Of the rucks that the Wallabies will steal, 18.2% will be inside the Wallabies 22, compared to 7.1% for the Springboks. This means that if the trend continues the Wallabies can commit less to the breakdown when they are inside the Springboks 22 but need to commit a few more in the Wallabies 22 or hope the ref helps them out.
I know this is a new graph and may take a couple of looks to read it, but any feedback would be nice.
Tackle time
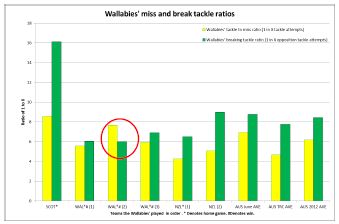
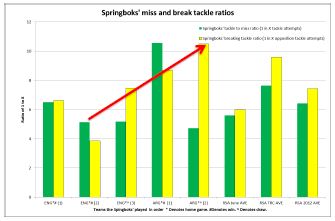
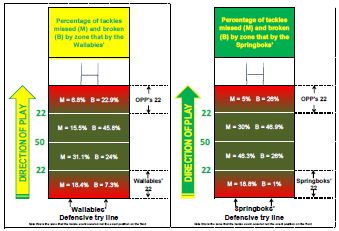
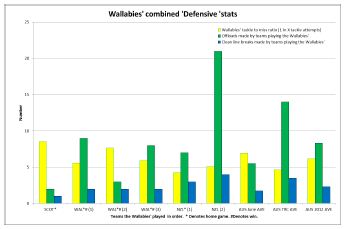
The Wallabies are breaking on average 1 in every 8.4 tackle attempts by the opposition and is worse than the 1 in 7.4 that the Springboks break (note 14). The Charts below show that the Springboks are getting better at breaking tackles.
When it comes to missing tackles the Springboks have very much improved on their 2011 missed tackle ratio. They were on averaging missing 1 out of every 3 attempts in 2011. I shit you not. In 2012 this has improved to missing 1 in 6.4 tackles attempts on average and is slightly better than the 1 in 6.2 the Wallabies miss (note 29). Remember I code all the games so my definition is the same.
From the chart below the Wallabies are missing more than they are breaking in all but the 2nd Welsh test. This is an area they need to work on.
Below I have done a field to compare the two teams and it shows they are missing about the same ratios in the same places. This means one missed tackle could really open things up.
The Springboks are offloading an average of 5.4 times per game and higher than the 4.2 Wallabies (note 15). While the Springboks are breaking tackles and offloading more than the Wallabies both teams are making the same amount of clean line breaks per game of 1.2to 1.3 (note 16).
Defensively the Wallabies are allowing their previous oppositions to offloads too much, or 8.3 per game compared to the 4.4 the Springboks allow (note 30). However much of this stats is the last game against the All Blacks and that dominated the defence chart a fair bit. The same could be said for the letting their previous opposition get clean line breaks, 2.3 per game and almost double the 1.2 per game that the Springboks allow (note 32).
Penalties and errors
A little weird and quirky stat has emerging on the penalties that are awarded to these teams. Both teams are receiving a penalty (or their previous 2012 oppositions are conceding, depends on your point of view) exactly 3 minutes and 34 seconds the ball is in play (note 28).
The Wallabies are making more lost possessions in a game than the Springboks in volume, 17.7 to 16.6 (note 33).However if you factor time in, they are making one every 1 minutes and 9 seconds they have the pill (note 34) and that is a little weird, again.
Penalties conceded are a higher for the Wallabies than for the Springboks, but not by much 10.3 to 9.4 respectively (note 36). The teams are being awarded about the same amount of penalties per game as they are conceding.
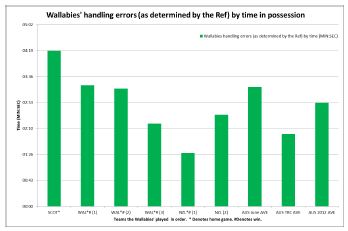
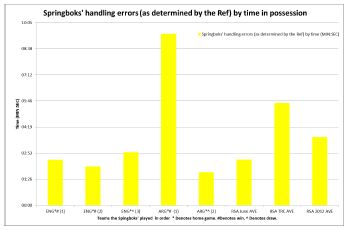
Handling errors by volume for these teams is about the same 7.0 for the Wallabies and 6.8 to the Springboks (note 41). When you introduce time these team have the pill then the Wallabies are making a handling error every 2 minutes and 53 seconds on average compared to the 3 minutes and 46 seconds that the Springboks do (note 42). That is a bit different.
The issue with handling errors is the Springboks are making about 1/3rd of them inside the opposition’s 22.
Set piece
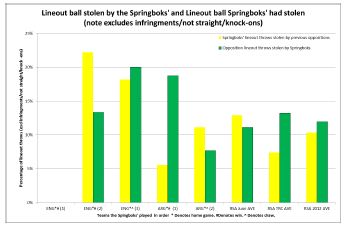
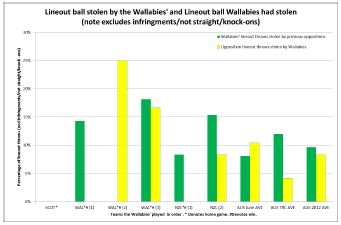
The Springboks are stealing/pinching 10.3% of lineout ball in the air (excluding infringements/not straight and knock ons) and the Wallabies 9.7%. The Springboks are stealing 12.0% and the Wallabies 8.3% (note 47).
These teams have about the same risk of throwing the ball not straight into the lineout (note 45).
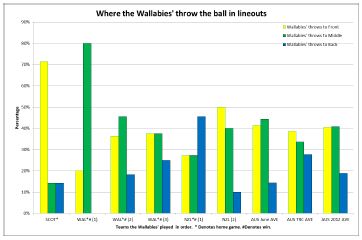
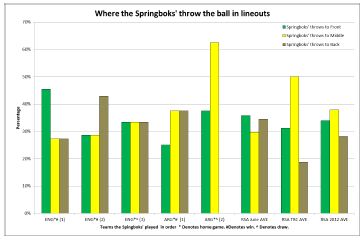
The Wallabies favour throwing ever so slightly the middle of the lineout over the front (note 46). The Springboks also like throwing to the front but do like throwing to the back a lot more.
As you know I have a probability function that predicts where the lineout ball is going to go. It has a real trouble predicting where the ball is going to go in the Wallabies lineout. This means that Sharpe is calling really well and not in any identifiable pattern that the computer can model, so far….
When it comes to scrums these team have the same probability of losing a tighthead (note 48).
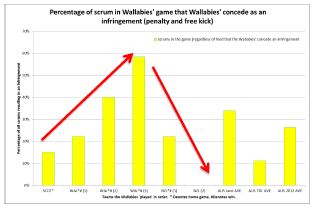
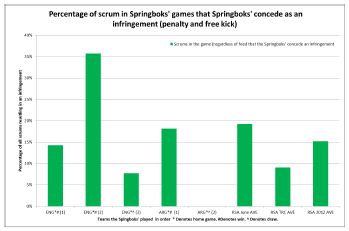
The Wallabies concede more scrum infringements, 26.3% this is higher than the Springboks with 15.2% (note 49). However this has been dropping over TRC so something has changed. The Wallabies are conceding a good spread of scrum penalties (note37) and free kicks (note 39).
Kickers in 2012
Wallabies
• Barnes 81% (34 from 42) Cons 9/12, Pens 25/30
• Beale 86% (18 from 21) Cons 14/16, Pens 4/5
• Harris 76% (59 from 78) Cons 22/31, Pens 37/47
Springboks
• M. Steyn 73% (105 from 143) Cons 44/59, Pens 61/84
• F. Steyn 17% (1 from 6) Cons 0/2, Pens 1/4
Ref stats: Nigel Owens has done 5 internationals in 2012
At scrum time Owens is averaging 3.6 resets per game, or 16.6% of scrums. He is handing out 5.2 scrum infringements (pens and F/K). On average 62% of the time it will be conceded by the defending team. So basically he hands outs infringements more than scrum resets, so don’t piss around with him. , he’s twice as likely to hand out a pen more than a free kick.
Owens is handing out an average of 18.2 penalties per game. On average 6.2 penalties will be inside the 22 and 7.2 penalties will become kicks at goal.
The penalty profile for Owens is, on average, per game:
• ruck/mauls 10.8;
• scrums 3.8;
• lineouts 0.4;
• offside 1.4;
• not already specified 1.8.
Of the ruck/mauls in the games Owens is in charge of, 6.4% end up as pens with 67.9% conceded by defending team.
Owens is 80% more likely to award a pen becoming a kick at goal on the LEFT side of the field than the RIGHT side. Out of all the international refs Owens preference is the most extreme.
All stats and info courtesy of www.ruckingoodstats.com
Related Posts
« Toyota Free State Cheetahs vs DHL Western Province – Bloem set for a humdinger Absa Currie Cup Awards for John Plumtree & Louis Fouchè »


